Google Analytics can do just about whatever you want it to. It has a ton of depth.
It can also feel a bit overwhelming once you get into it.
After consulting on Google Analytics for years, we have 10 customizations we consider vital for every site we run.
Once they’re in place, you’ll have:
- Keyword data in Google Analytics. Yes, we’re completely serious. Keyword data is back.
- An account structure that will save you if you ever accidentally nuke your Google Analytics data.
- Metrics to help you drive your business.
- A roadmap to clean up your URLs to make your reports accurate. (They’re not as accurate as you think they are.)
- Alerts to help you catch catastrophic data failures within 25 hours.
- The Google Analytics tracking script installed like the pros.
- A method to filter out data from your office IP so your company doesn’t accidentally skew the reports.
Let’s dive in.
Connect Google Analytics to Google Search Console
Way back, Google Analytics used to have keyword data in all its standard reports. You were able to see which keywords sent traffic to which pages. And if you had ecommerce tracking or goals set up, you could see how much revenue each keyword produced for you.
It was amazing.
Then Google decided to remove the keyword data from Google Analytics.
So, instead of amazing keyword data, everything got lumped into the dreaded “not provided” group.
Google killed the keyword data in Google Analytics.
We thought the keyword data was done forever — we never expected to see it again. We resigned our fate to needing tools like Semrush or Ahrefs for keywords.
Then a funny thing happened.
Google started investing a lot of time into improving Google Search Console. In the last few years, it’s gotten incredibly good. The data is a goldmine. Google also improved the integration between Google Search Console and Google Analytics so it’s now possible to get a lot of that missing keyword data back.
That’s right, keywords are back in Google Analytics. All you have to do is sign up for a free Google Search Console account and connect it to your Google Analytics account.
It’s pretty easy. There are only two steps:
- Create a free Google Search Console account and verify that you have access to your site. The easiest way to verify is if you already have Google Analytics installed.
- In your Property settings in Google Analytics, connect to your Google Search Console.
Here’s where to find the settings in Google Analytics to turn on Google Search Console:
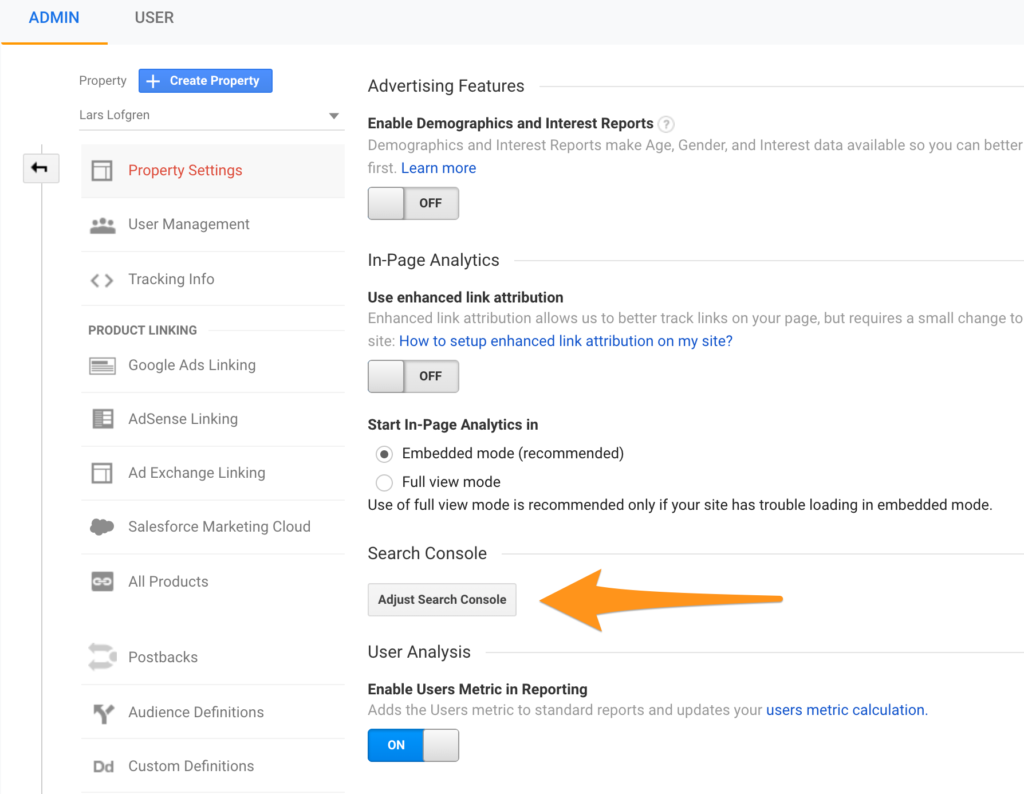
After the accounts are connected, all the reports under Acquisition – Search Console will start populating. Keep in mind that they have a 48 hour delay so give it a few extra days before checking for data.
Create Multiple Views
We consider this a mandatory customization for Google Analytics.
Once data makes it into your Google Analytics reports, it’s permanent. Nothing can change it. Google has an entire processing pipeline for all the data it collects. Once data has been processed, there’s no going back.
So what happens if you use one of these Google Analytics customizations and accidentally nuke your whole account?
That data is permanently gone. When you fix the setting in your account, you won’t get any of your old data back. Only data from that moment onward will be clean.
Even if you just make your reports a bit messier with the wrong setting, there’s no going back.
In other words, the stakes are high.
We all make mistakes. And it’s a good idea to create two extra views for your Google Analytics profile as a backup.
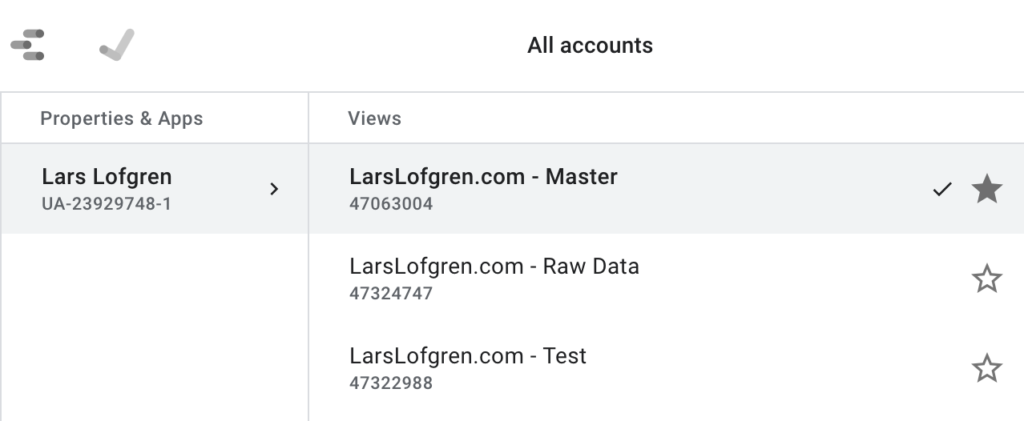
On every one of our Google Analytics properties, we create three views:
- Master View = This is the main view you’ll do all your analysis with.
- Test View = Before adding a new setting to your Master view, add it here first. This allows you to test it out before impacting your real data.
- Raw Data View = Leave this view completely untouched without any settings configured. If something goes horribly wrong, you always have this base data to work with.
Your Google Analytics views should look like this:
Set Up Events
Google Analytics tracks a ton of stuff without any customization which is why it’s so popular. There’s a ton of value right out of the box.
Sometimes, there are other actions that are also worth tracking beyond the standard sessions, pageviews, bounce rates, and time on site. You might want to track:
- Account creations
- Email signups
- PDF downloads
- Video plays
- Calculator or other tool usage
- Contact form submissions
- Webinar registrations
- Clicks on important links
Anything that’s important to your site can be turned into a Google Analytics event so you can track how often it’s happening.
To trigger events, you will have to add some code to your site that sends the event data whenever the action occurs. Most likely, you’ll need a developer to help you set this up. All the event documentation is here.
Define Goals
In our experience, folks go overboard with goals. Hitting 10 pageviews per visit is a goal, signups are goals, PDF downloads get goals, random events are goals, goals goals goals everywhere.
Usually when we start working on a new site, we end up having to delete a bunch of goals that don’t matter.
Our rule: only 1 or 2 goals per site. And they should be goals that closely track to revenue. So if the goal goes up, we expect revenue to also go up. If the correlation to revenue is weak, use an event instead of a goal.
Some examples of good goals:
- Free trial sign up for your software
- New email subscription
- Demo request
- Consultation request
- Affiliate link click
- Webinar registration if this leads to a sales funnel. If it’s a normal content-based webinar, we prefer not to set it up as a goal.
Any event that leads to a sales funnel is a good candidate for a goal. There are really two ways to set up goals like these.
URL Goal
If your site is set up in a way that users always hit the same URL after completing one of these key actions, you can tell Google Analytics to trigger a goal every time someone lands on that URL. This works great for “thank you” pages.
No code is needed for these, you can set it up right away.
Event Goals
It’s also possible to have Google Analytics trigger a goal any time an event fires. This gives you the flexibility to trigger a goal whenever you like since it’s possible to trigger events whenever you like.
You most likely need a developer to help you set these up. Ask them to create a Google Analytics event for you. Once you see the event tracking correctly in the Google Analytics event reports, then go set up a Goal using the values of your event.
Why go through the trouble of turning an event into a goal? Why not just look at the event reports? It makes getting conversions data in your reports a lot easier. Many of the reports are pre-configured to show conversions based on goals. It’s trickier to get the same reports based on just events.
Implement Ecommerce Tracking
If you have an ecommerce store, Google Analytics ecommerce tracking gets all your revenue data into your reports. It’s amazing.
You’ll be able to see:
- Which traffic sources produce the most revenue
- Traffic sources that produce a lot of traffic but no revenue
- The pages that bring in new visitors who end up purchasing
- The user flows on your site that lead to revenue
- How users go through multiple traffic sources before they end up purchasing
Google Analytics doesn’t track any of your ecommerce purchases out of the box. You will need to set up some extra stuff.
There are only two ways to get this set up:
- If you can edit the code of your checkout flow, there’s extra JavaScript tracking that will send purchase data to your Google Analytics account.
- Some ecommerce tools have ecommerce tracking built in. All you have to do is turn it on, hook it up to your Google Analytics account, and the data will start showing up.
First, go check your ecommerce tool and see if it has a built-in integration. Shopify has one. And if you’re not on Shopify, consider migrating. It’s worth the switch.
If you need to set up ecommerce tracking by hand, all the developer documentation is here.
One last thing, remember to turn on ecommerce tracking in your Google Analytics settings:
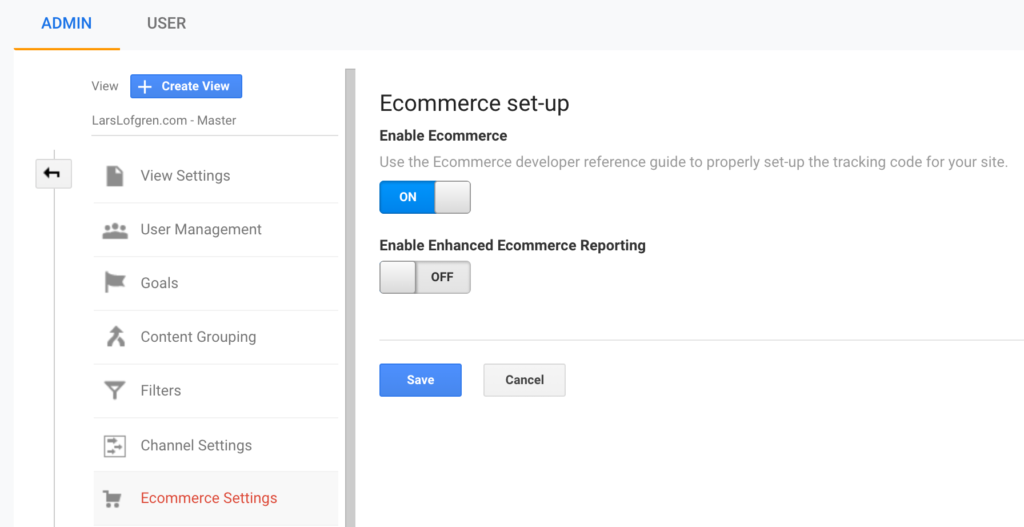
You need to flip the switch before data will start showing up.
Content Groups
Out of everything on the list, Content Groups are the most situational customization. Most sites don’t need to set these up — they’ll amount to nothing more than busy work that’s quickly forgotten about.
But for editorial and ecommerce sites, they make an enormous difference.
Google Analytics considers all your URLs to be equal. It doesn’t lump them into subgroups at all.
If you have a large site and manage the site by sections, this becomes a real problem. You might have Money, Heath and Fitness, and Political news sections that are all managed by different teams.
Or, maybe you have different merchandize groups for your ecommerce store. How do you track the performance of those different sections of your site?
You can’t do it with an internal spreadsheet; new posts and products go up too fast to keep one accurate. Even if you can make it work, it’s a real pain to keep updated.
Setting up unique Google Analytics views is one option but only really works if every category has a clean subfolder in your URL. Plus, creating unique Google Analytics properties for each section creates all sorts of extra problems with referrals and tracking everything in aggregate.
The solution? Google Analytics Content Groups.
Using either the Google Analytics settings or by appending your Google Analytics JavaScript with a bit of extra code, you can categorize your site pages into whatever groupings you want.
Once you’ve set up Content Groups, you can take any report in Google Analytics and organize all the data by any content group you’ve set up. For major editorial and ecommerce sites, it saves countless reporting hours.
Clean Up Parameters
It’s pretty common to run into pages like this in your Google Analytics reports:
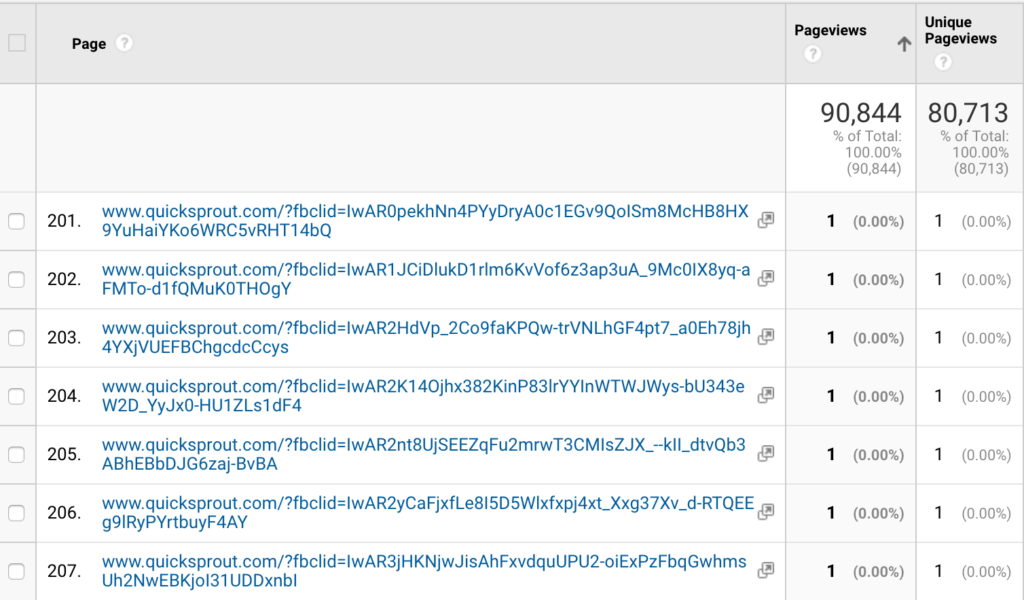
Anything after a “?” in a URL is a parameter. It’s common for tools to add URL parameters to a URL. These parameters don’t change the destination of the URL, they add extra data that various tools can then use.
The problem is that Google Analytics treats parameters as unique URLs. In other words, traffic to the same page will show up in Google Analytics as visiting different URLs simply because the parameters for each user were different.
This splits our pageviews across a bunch of different URLs instead of giving us the real total for a single page on our site. That’s exactly what’s happening in the Quick Sprout example above.
Instead of having 7 pageviews for our homepage, we have 7 pageviews split across unique pages because of a unique fbclid parameter that was added.
There’s a bigger problem too.
A lot of marketing automation and email tools will add ID parameters to the end of every URL in their emails. That allows them to track what email subscribers are doing.
Even worse, it can populate reports with personal information like email addresses and names. It’s against the Google Analytics terms of service to have personal info in any report so you definitely don’t want this data to end up in your reports.
Here’s how parameters work:
- The end of the URL and the beginning of the parameters is marked with a “?”
- Every parameter has a name and a value. The name is before the “=” and the value comes after.
- Parameters are separated by an “&” so if you see an “&” in the URL, that means there’s multiple parameters.
To clean up your reports and scrub personal data clean, go to the All Pages report. Then sort by least pageviews. This will give you a list of URLs that only had a single pageview. Scroll through about 100 pages and look for any parameters that don’t signify a real URL.
Once you have a list of parameters that are junking up your reports, go to your View settings and add all the parameters that you want excluded here:
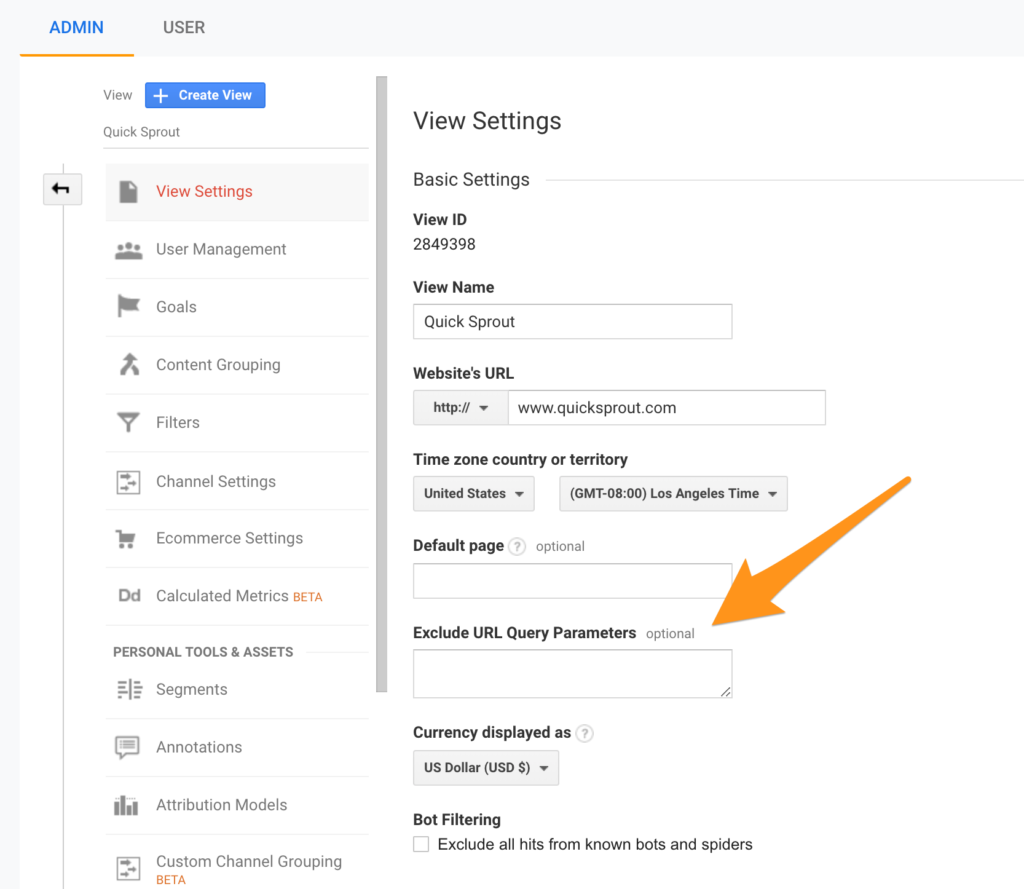
Be careful though. Some sites use parameters for different pages. We personally think it’s a terrible way to structure a site but it does happen. If your site does this, don’t include the parameter for those real pages. Otherwise Google Analytics will stop tracking the pages entirely.
Also don’t include any of the standard UTM parameters that are used to track marketing campaigns. Google Analytics already handles that data correctly.
Install Google Analytics via Google Tag Manager
In our post on setting up Google Analytics, we advocated for skipping Google Tag Manager when setting up Google Analytics for the first time. We still stand by that, especially for folks creating their site for the first time. When you skip Google Tag Manager as a new site owner, you skip a lot of emplexity without giving up much.
Long term, using Google Tag Manager is a good habit to get into. It saves a bunch of headaches down the road that large sites run into. Keeping all of the JavaScript tags from all your marketing tools in a tag manager makes updates, maintenance, and audits super easy.
Again, if you’re running your site by yourself and hate the thought of learning one more tool, feel free to skip this.
For everyone else, it’s time to remove your Google Analytics Global Site Tag from your site, install Google Tag Manager, and then add Google Analytics to your tag manager.
Once you’ve removed Google Analytics JavaScript from your site, follow these steps:
- Create a Google Tag Manager account and set up a workspace for your site.
- Install the Google Tag Manager Javascript in the same place on your site that you previously installed Google Analytics directly. The JavaScript is under the the Admin section of your Google Tag Manager account.
- Create a new tag under your workspace.
- For tag type, choose “Universal Analytics”
- Choose “Page View” for track type.
- Under Google Analytics Settings, choose “New Variable” and adding your Tracking ID.
- Add a trigger that fires the tag on all pages.
- Save your tag and publish your workspace. Don’t forget to publish the new workspace; you have to “push” to production otherwise your changes won’t go live.
Your tag will look like this when you’re done:
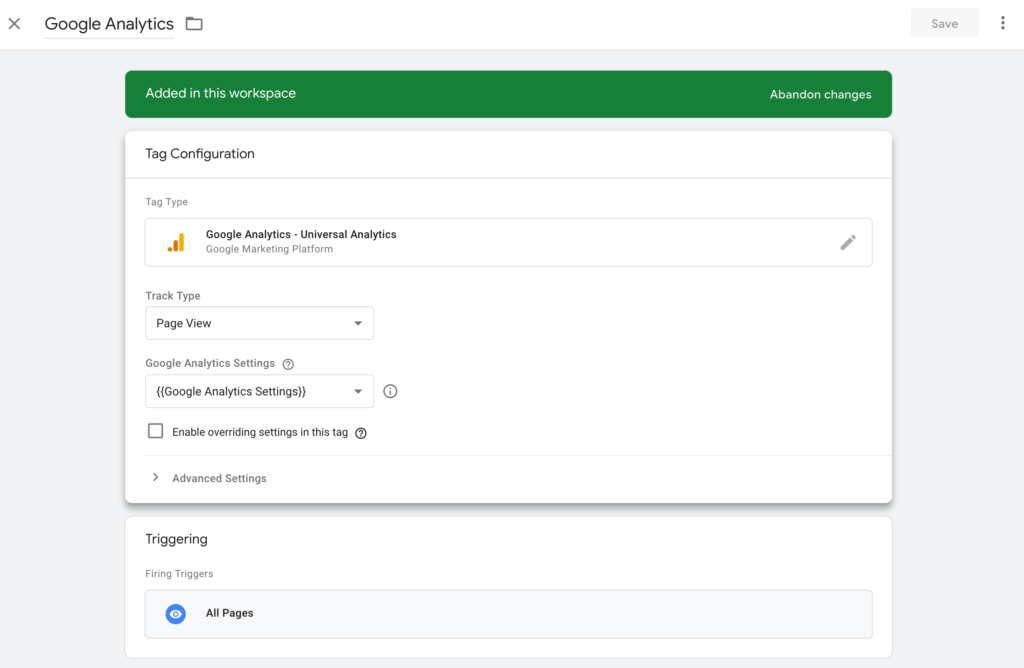
To make sure that Google Analytics is working through Google Tag Manager, check your real-time reports in Google Analytics to see if it’s successfully recording data.
Create Custom Alerts
Sooner or later, you site will get hit. Here are a few scenarios that we’ve personally been through:
- A site redesign was launched and Google Analytics was missing when it was pushed to production.
- Another site redesign launched and cut our sign-up flow by 50%. Tracking was working, the new site just didn’t convert nearly as well as the old site.
- Someone was making a few changes to the site and accidentally removed Google Analytics from the entire site. It was missing for about 24 hours before we caught it.
- Google launched a bug in its search algorithm and we lost 40% of traffic in about 30 days.
- On a different site, we lost 40% of our search traffic in 30 days after Google recrawled our site and lowered all our rankings.
- New sign-up infrastructure launched and broke our sign-up tracking, the primary goal of the site.
- We launched a new pricing page and cut our sales pipeline by 50%.
Most of these examples are pretty embarrassing.
Sooner or later, they happen on every site. We find that we run into 1–2 per year.
To help catch major problems like these, Google Analytics has Custom Alerts. You define a set of criteria and whenever that event happens, Google Analytics will send you an email. Even if your team isn’t checking Google Analytics daily, you’ll still catch major problems within 24 hours.
Here’s the alert we like to set up:
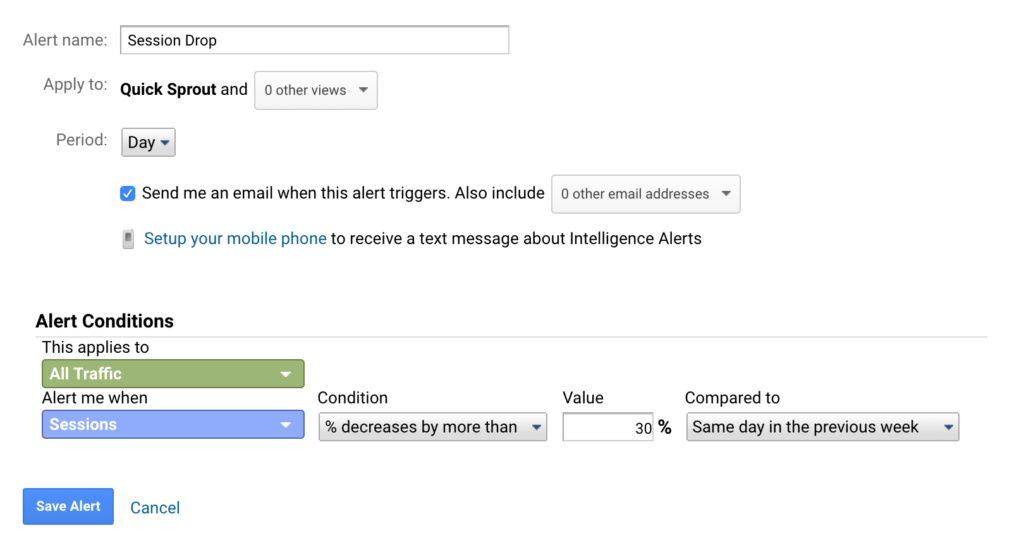
This alert sends us an email whenever sessions decrease by 30% or more compared to the same day the previous week. A few tricks that we’ve learned about custom alerts over the years:
- Alerts by day are the most useful. This will catch catastrophic problems that tank your data immediately. It can take longer for those problems to show up in weekly or monthly data. We also find that normal reporting is good enough to catch the weekly or monthly changes.
- We try to only set up a handful of custom alerts. One for total traffic and one for the primary conversion event on the site are usually enough (sign up, purchase, etc). If too many alerts fire, it becomes a bunch of noise.
- Comparing to the previous week is helpful. Most sites have huge traffic differences between the week and the weekend which are totally normal. These normal fluctuations can trigger alerts if you compare day to day.
- Increase the trigger percentage if you find that you’re getting too many false alarms.
- Some folks set up alerts for positive increases too. We never found them that useful personally. Good news has a habit of taking care of itself. It’s bad news where every minute counts.
Add an Office IP Filter
In Google Analytics, filters give you complete and total power. You can remove and transform your data permanently.
And when we say permanently, we do mean permanently. Be careful with these things. Once a filter is live, it’ll change all the data that’s collected. There’s no way to undo it. If a bad filter is applied, the only fix is to remove it and clean up data that’s collected after. There’s nothing that can be done to fix the old corrupted data.
So proceed with caution on these things.
There’s one filter that many websites should apply: a filter to remove internal traffic.
If you’re running your own business out of your house or from a coffee shop, don’t worry about this at all. The data impact from a single person is so limited that it’s not worth the hassle of adding a filter and maintaining one more setting in Google Analytics.
Whenever we start to see the impact of our browsing habits on one of our websites, our first thought is: “We need to spend our time getting more traffic.” At that stage, we prefer to worry about big things like getting enough traffic and customers.
However, there is a situation where an office IP filter becomes a requirement. When you’re working on a larger website with an entire team of people employed, skewing your traffic data becomes a real possibility. If a couple hundred people all work on the same website, Google Analytics data will become biased.
If your company works out of an office (or several offices), it’s worth the effort to figure out the IP address of your office and apply a Google Analytics filter that excludes all data from that IP. That keeps your employees from skewing your Google Analytics reports during their day-to-day work.
Here’s what your Office IP filter will look like:
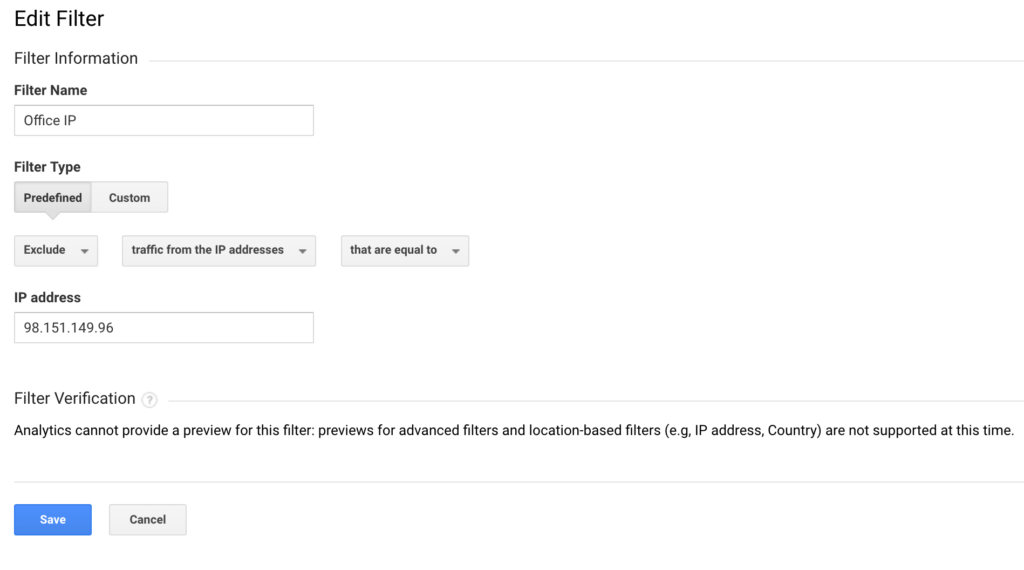
This filter tells Google Analytics to take all data from an IP address and completely ignore it.
Remember to use the new views that you set up earlier. First apply the filter to your Test view, give it a few days to make sure it’s working properly, then apply the filter to your Master view.
Filters are so powerful that you always want to test them first. All it takes is accidentally selecting “Include” when you meant “Exclude” to permanently nuke your entire Google Analytics account until your discover the mistake.
